Whenever the topic of gerrymandering comes up, it's easy to find cherry-picked examples. Each side points to a handful of districts to "prove" the other is rigging the game. But what happens when you step back and look at the data across states?
Take this one that has been circulated by Republicans on X:
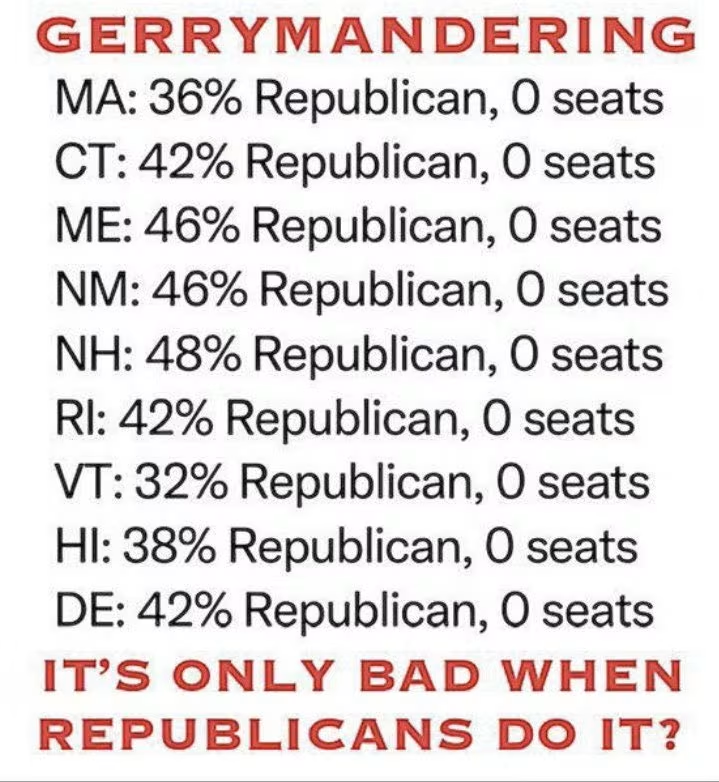
It points to places like Massachusetts, Connecticut, and Rhode Island, where Republicans earn 30–45% of the vote but end up with zero House seats. At face value, it looks like Democrats are rigging the system.
The problem? These are all small states with just 1–3 congressional districts. In a state with one seat, the winner at 51% gets 100% of the representation. That distortion is unavoidable—it's just math. Republicans also left out states like Arkansas, Idaho, and Wyoming, where Democrats face the same issue in reverse.
That's why cherry-picking doesn't work. To really see what's happening, you need to step back and look across all states together.
Methodology
Two things matter when analyzing gerrymandering:
- Voting trends can shift. Presidential elections are shaped by personalities at the top of the ticket. Polarizing figures like Trump can pull in new voters or repel others, making presidential results a noisy baseline.
- Redistricting follows the Census. States redraw their maps once a decade. The 2022 midterms were the first elections held under the new maps, which makes them the cleanest test. If gerrymandering exists, its effects show up most clearly here.
So I used the 2022 congressional vote shares, not 2020 presidential results. That way we remove presidential personality effects and line it up with the first election cycle after redistricting.
The comparison is simple:
- If a party wins 55% of the vote in a state, they should win about 55% of the seats.
- Large gaps between vote share and seat share suggest skewed maps.
Concerns & Limitations
- Small states look extreme by default. In states with only 1–3 districts, even modest swings in the vote can produce what looks like a huge mismatch. A single-district state gives 100% of representation to whoever wins just over 50% of the vote. That distortion isn't gerrymandering—it's simply how single- and small-district math works.
- Aggregation smooths it out. When looking across ~20 small states, these quirks balance out. More importantly, the analysis is weighted by the number of districts each state has, so smaller states don't skew the totals.
- Seats, not populations. The final comparison is based on the number of "extra" seats" a party gains beyond proportionality, not on population percentages. That way, the measure captures actual congressional power, rather than overemphasizing distortions in very small states.
Republican-leaning states
In places like Florida, Texas, and Tennessee, Republicans consistently turned votes into more seats than proportionality would allow.
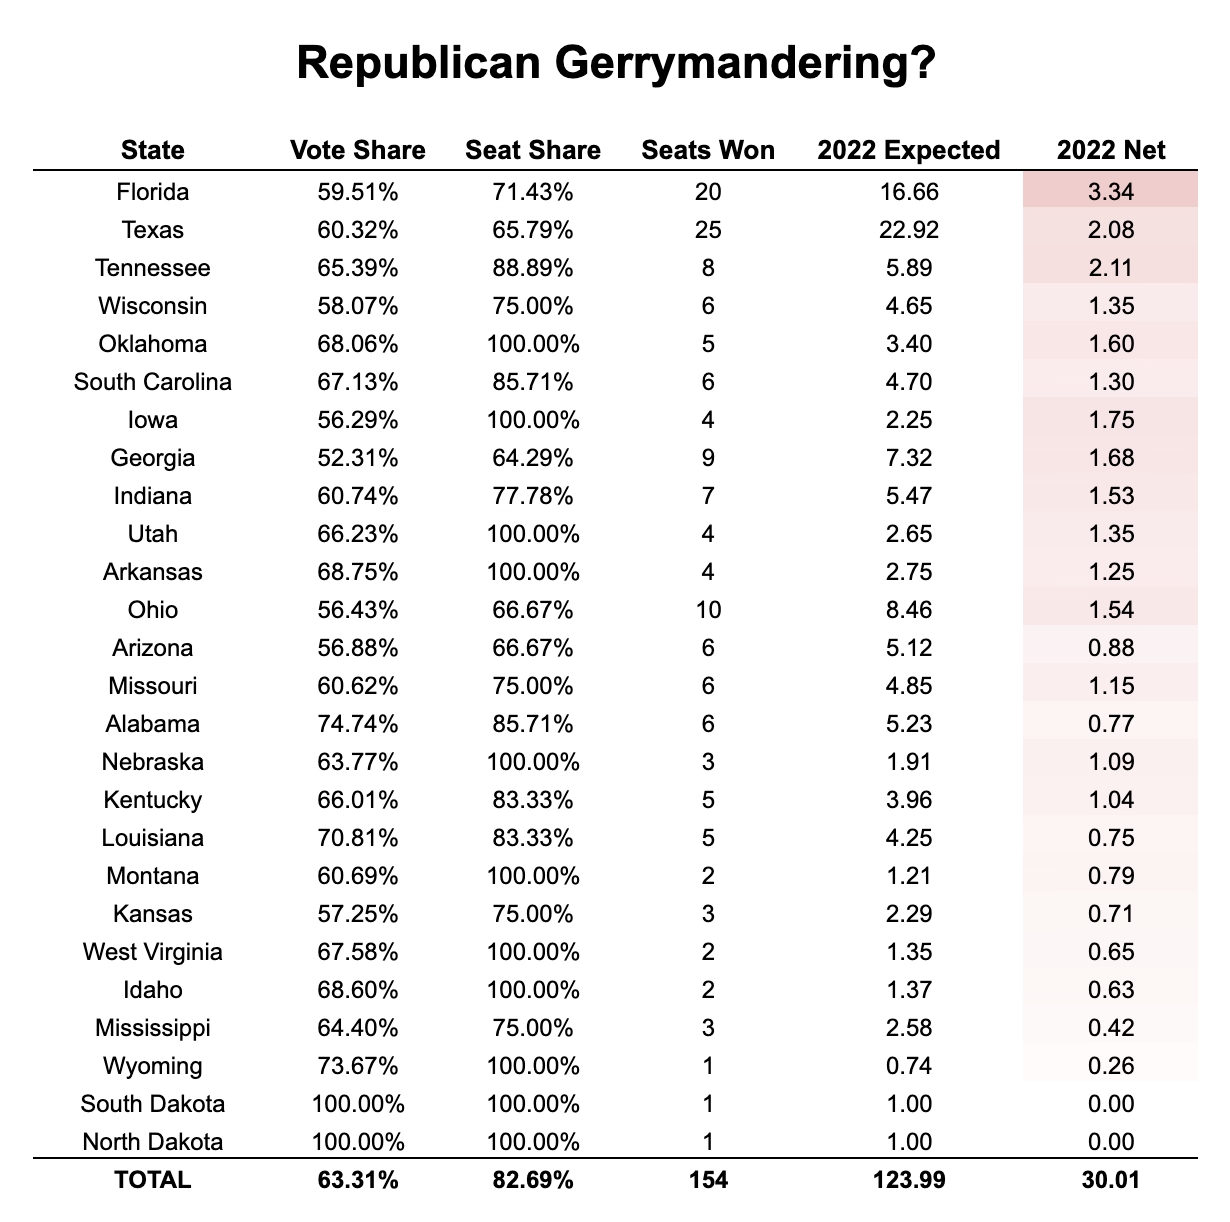
- Florida: 59.5% of the vote → 71.4% of seats (+3 seats).
- Tennessee: 65% of the vote → nearly 89% of seats (+2 seats).
- Across all GOP-favored states, Republicans averaged 63% of the vote but 83% of seats—a bonus of ~30 seats beyond proportionality.
Democratic-leaning states
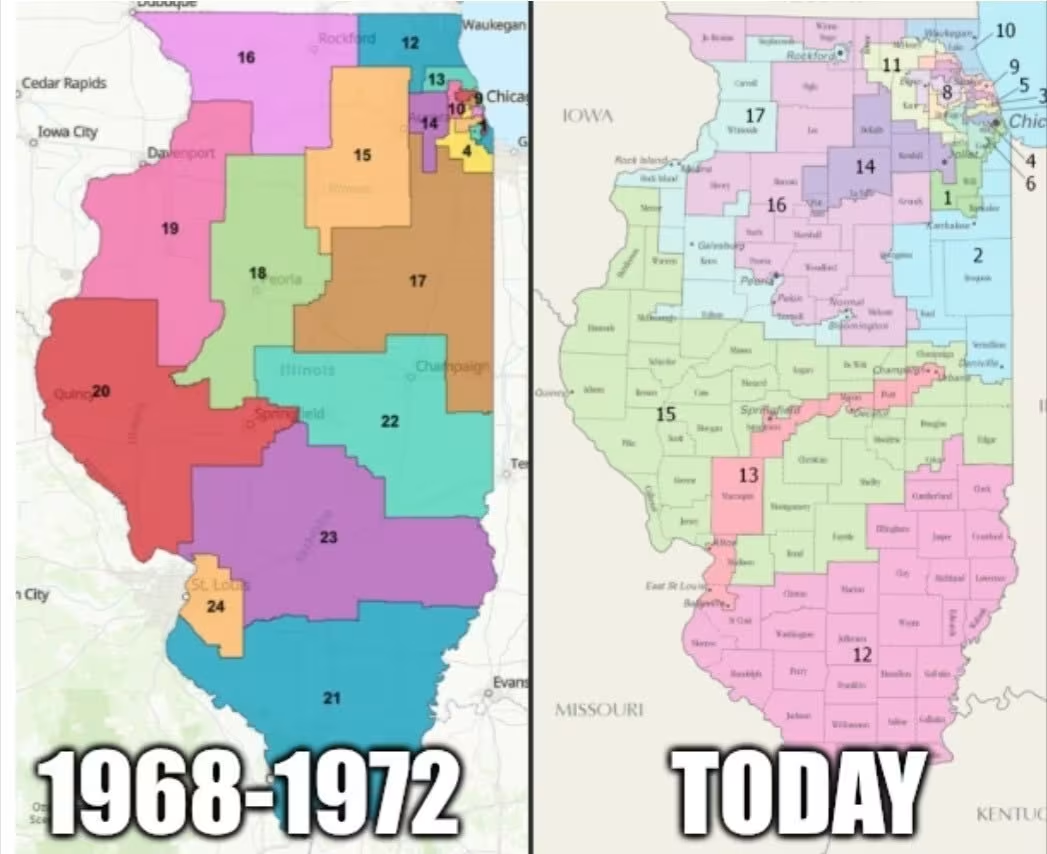
Democrats also benefit from tilted maps, particularly in California and Illinois:
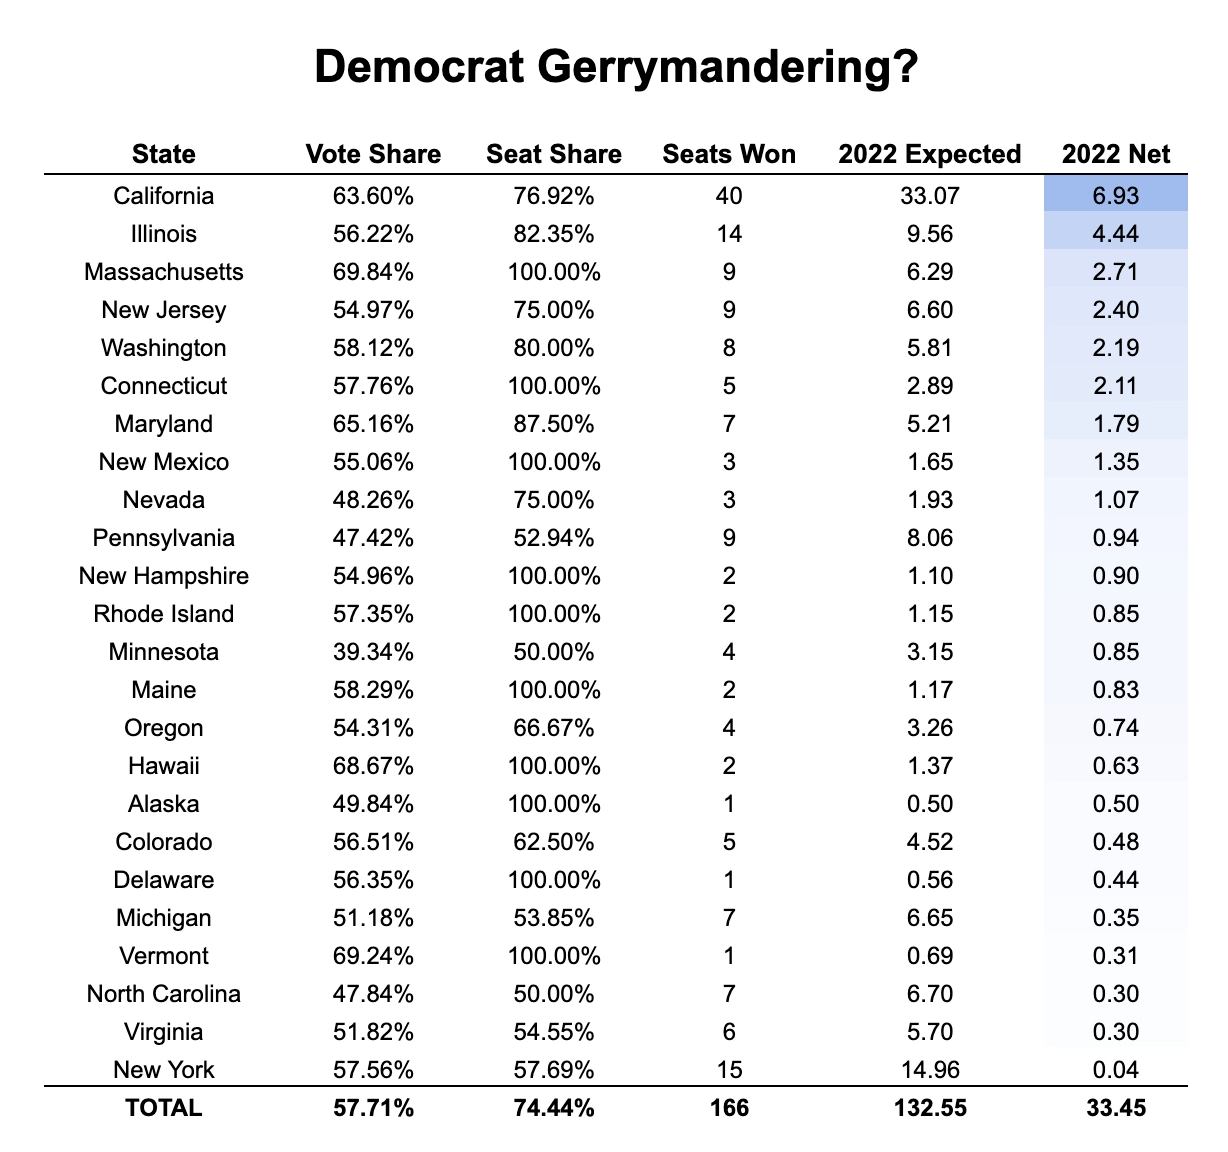
- California: 63.6% of the vote → 77% of seats (+7 seats).
- Illinois: 56% of the vote → 82% of seats (+4 seats).
- Across Democratic-favored states, the party averaged 58% of the vote but 74% of seats—a gain of ~33 seats beyond proportionality.
Takeaways
- Both sides gerrymander. Republicans net ~30 "extra" seats; Democrats net ~33.
- Timing matters. The 2022 midterms are the clearest snapshot: fresh maps, stable turnout.
Want the Raw Data?
If you'd like to dig deeper—by state, by competitiveness, or by swing districts—reach out to me on X. I'm happy to share the dataset and filtered views so you can make your own conclusions.